
What Does DMA Measure: From Equipment Structure to E′·E″·tan δ Graphs
This article explains the structure and measuring principles of DMA equipment, along with examples of calculating storage modulus, loss modulus, and tan δ graphs.
Polymer pads cannot entirely explain behavior under repeated loads based on deformation from a single press.
Dynamic Mechanical Analysis (DMA) measures the response of materials under small oscillating loads or deformations.
The key is not only the magnitude of force and deformation but also the phase difference between the two signals.
This article aims to help understand the principles of solid polymers, and does not provide a specific operation manual for any equipment or medical device acceptance criteria.[1, 2]
What Moves Inside the Equipment
DMA can be understood as comprising a jig that holds the sample, a drive unit that creates repetitive motion, a measurement unit that reads force and displacement, and a space that controls temperature.
The actual sensor position and control method vary by equipment.
In compression mode, samples placed between two plates are repeatedly compressed, while other jigs and deformation methods are used in tensile, bending, and shear modes.
Thus, it is essential to view both the sample holder and measurement mode together rather than judging based solely on photographs of the equipment.[2, 3]
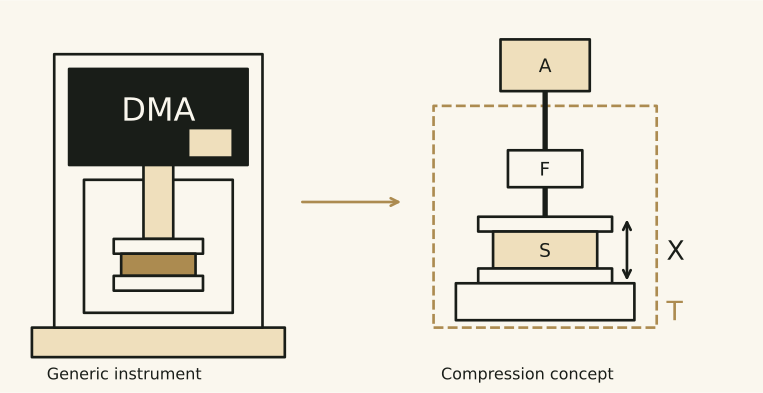 Figure 1.
This is a conceptual diagram of a DMA structure created in-house.
The left shows the typical appearance of the body, while the right enlarges the area around the compressed sample.
This is not a diagram reproducing any specific manufacturer’s product or actual sensor arrangement.
In the above image, A indicates the part creating repetitive motion, F indicates force measurement, X indicates displacement measurement, S indicates the sample, and T indicates the temperature control area.
Stress and strain are obtained through geometric conversions such as dividing force by the sample cross-sectional area or linking displacement to a reference length.
Bending mode requires specific conversions suited to the jig and sample shape.
It cannot be concluded that a material has high elasticity just because it required a lot of force.
Thickness and fixing methods also influence the results.
Why Read the Time Difference Between Force and Deformation
When explaining linear viscoelastic responses, if we assume stress applied as a sine wave, the strain may respond at the same period but with a phase delay.
Let σ₀ be the stress amplitude, ε₀ be the strain amplitude, and δ be the phase difference.
The magnitude of complex modulus \\|E^*\\| = σ₀/ε₀.
The elastic component E′ = \\|E^\\| cos δ and the loss component E″ = \\|E^\\| sin δ, with tan δ = E″/E′.
In equipment controlling deformation, the stress response may be expressed as leading the deformation.
Confirming which signal was used as a reference allows the same relationship to be understood.[1, 2]
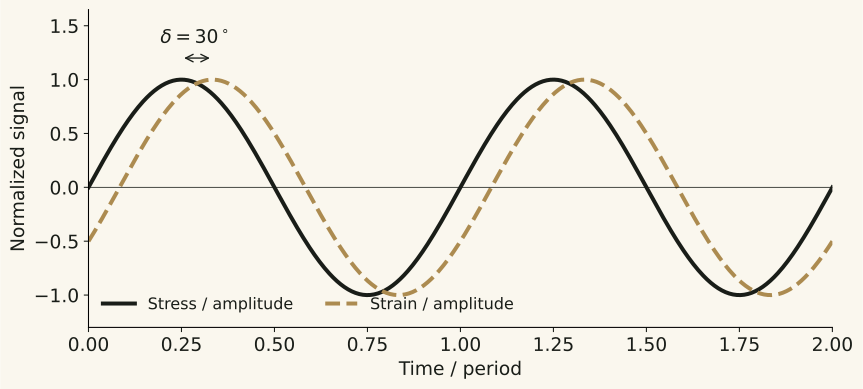 Figure 2.
This example illustrates the relationship of strain appearing later than stress based on stress as a reference.
The vertical axes are normalized for each amplitude, so equal heights of the two lines do not imply equal magnitudes of actual stress and strain.
The δ = 30° is a setup value for explanation.
The storage modulus E′ is linked to the elastic energy stored during deformation, while the loss modulus E″ is linked to the energy dissipated per cycle.
Both use stress units such as Pa or MPa.
Tan δ has no units as it is a ratio of the two components.
In shear mode, G′·G″ notation is used instead of E.
Different modes should not be compared directly, disregarding this notation difference.[1, 2]
Shape of the Graphs: Frequency Sweep and Temperature Sweep
A graph with frequency on the horizontal axis shows results obtained by varying the repetition speed while holding temperature constant.
In contrast, a graph with temperature on the horizontal axis shows results from changing temperature at a fixed frequency.
Even if similar peaks appear in both graphs, they represent different experiments.
The following illustration is a simple viscoelastic model calculated directly and is not actual measurement data from pads.
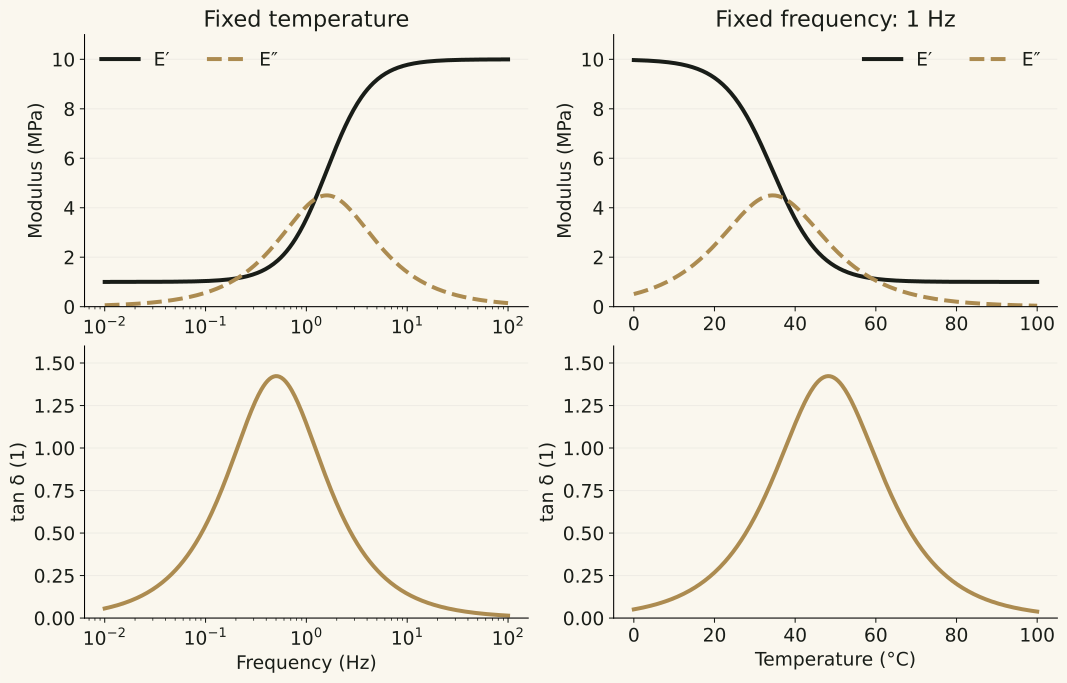 Figure 3.
The black solid line represents E′, and the gold dotted line represents E″.
Tan δ is separated below, so values with different units are not read on the same vertical axis.
The left side represents a virtual calculation with temperature held constant, while the right side shows a frequency of 1 Hz.
The model coefficients and temperature range are for explanatory purposes and do not represent recommended values for test settings or product performance.
| Reading Position | Change Seen in This Concept Example | Conditions to Attach When Interpreting |
|---|---|---|
| Left E′ | Increasing with higher frequency | In this model, the elastic response to rapid deformation increases. Not all polymers change uniformly across all frequencies. |
| Left E″ | Peak in the intermediate zone | Near the area where the time scale of the selected relaxation process aligns with that of the repetitive motion. This does not necessarily suggest that loss continues to increase. |
| Right E′ | Decreasing with rising temperature | In this model, increasing temperature shortens relaxation time. Real sample crystallization, hardening, and breakdown must be considered separately. |
| Right E″ and tan δ | Maximum at different temperatures | Since tan δ is the value of E″ divided by E′, it does not need to coincide with the peak position of E″. |
When interpreting the glass transition region in an actual temperature sweep, different criteria are used, such as the onset of decline in E′, the maximum point of E″, and the maximum point of tan δ.
Therefore, if only Tg is noted in a report, it is crucial to check which signal and method were used to determine it.
Frequency should also be compared, and transition temperatures obtained from DMA and DSC should not be treated as the same numerical basis.[4]
Before Mounting the Sample and Setting Measurement Conditions
Sample shape and size, fixing state, and measurement mode should be organized beforehand.
Supporting methods and conversion results differ when stretching thin films versus compressing thick pads.
Issues such as whether contact is maintained during compression or whether the sample slips during tension are factors to review before graph interpretation.
Actual settings and calibrations must follow the guidelines from the equipment and jig manufacturers.[3]
In the linear viscoelastic range, the modulus is generally constant even if the small strain amplitude is changed.
Amplitude sweeps are a method to explore this range under the selected conditions.
Whether the range verified at one temperature applies throughout the entire temperature-frequency domain needs separate review.
In this article, we do not define common strain rates or allowable change rates as acceptance criteria.[5]
Practical records can include sample identification and dimensions, pretreatment and storage conditions, jig and measurement mode, static load or initial tension conditions, dynamic amplitude, temperature and frequency ranges, temperature change rates, and equilibrium conditions.
This list is a suggestion from MedQraft.
It is essential to cross-check items required by applied testing methods with those the equipment actually controls and records.
Virtual Review When Results Change
Assuming that E′ of pad samples A and B taken from the same material yield different results, rather than immediately categorizing this as material defect, first check whether their measurement modes, temperature, frequency, amplitude, and sample dimensions are the same.
If differences persist after matching conditions, differences between samples and repeatability, pretreatment history, etc. can be reviewed.
This order is not a procedure for concluding causes but an exercise for organizing comparative questions.
What can be understood through DMA is viscoelastic behavior under fixed conditions.
To judge the ultimate suitability of the pads for their intended use, separate performance evaluations needed under actual product shapes and load conditions must be connected.
It is not appropriate to rank materials solely as better based on a high E′ or low tan δ; the interpretation's purpose varies depending on whether the part requires support or aims to minimize vibration.
Calculation Method for Conceptual Graphs
In Figure 3, a standard linear solid model was employed using a parallel arrangement of a balancing spring and Maxwell elements.
E′ = E∞ + ΔE(ωτ)²/[1+(ωτ)²], E″ = ΔEωτ/[1+(ωτ)²], ω = 2πf.
Explanatory coefficients are E∞ = 1 MPa, ΔE = 9 MPa.
The left uses τ = 0.1 s while the right uses f = 1 Hz and an arbitrary function τ(T) = 0.1 exp[-(T-40)/12] s.
This temperature-dependent function is not a fitting formula against real-world data or a property formula for specific materials.
This is a disclosure of assumptions to reproduce mathematical relations between the graphs.
Sources and Verification Scope
All confirmation dates are 2026-10-18.
Manufacturers’ public technical explanations were used for principle verification.
No promotional figures or graphs from competing products were reproduced.
- TA Instruments, TA441: Introduction to Dynamic Mechanical Analysis and its Application to Testing of Polymer Solids.
- NETZSCH, DMA 503 Eplexor: Principles and Measurement Configuration, pp.\ \ 3~7.
- NETZSCH, DMA 242 E Artemis: Sample Holders.
- TA Instruments, RH100: Measurement of Glass Transition Temperatures by Dynamic Mechanical Analysis and Rheology.
- TA Instruments, RH110: Temperature and Frequency Trends of the Linear Viscoelastic Region.
Let's talk
Apply what you have read
to your product.
Tell us your product's current stage and the questions you need to review.
Discuss your questions ↗