
Reading DSC Curves: Glass Transition, Melting, and Thermal History
How do we distinguish between steps and peaks when comparing DSC results of polymer components? This article organizes the sequence of interpretation using three figures and a virtual lot comparison case.
If the curves are different, first define the purpose of the comparison
We have received DSC results for two lots of polymer components.
One appears to have a different shape in the transition region.
Can we immediately conclude that "the resin has changed" or "one is a better product than the other"?
It's better to divide the questions first.
Depending on whether you want to compare the current state of the received components or compare the material’s reaction after applying specific thermal histories, the regions to read will differ.
The first and second heatings within the same file can answer different questions.
This article serves as an introductory commentary on DSC for readers reviewing polymer materials and components used in medical devices.
The below lot comparison case and review sequence are constructed by MedQraft as a virtual example and practical suggestion.
This is not a document presenting test methods or acceptance criteria for specific materials.
DSC examines heat flow due to temperature changes
DSC is an analysis method that observes thermal changes in a sample under a specified temperature program.
In typical heat flux methods, a sample pan and a reference pan are placed in the same heating space, and the difference in thermal responses at these two positions is measured to convert into heat flow information.
The reference pan is generally empty.
Official DSC Fundamentals by METTLER TOLEDO
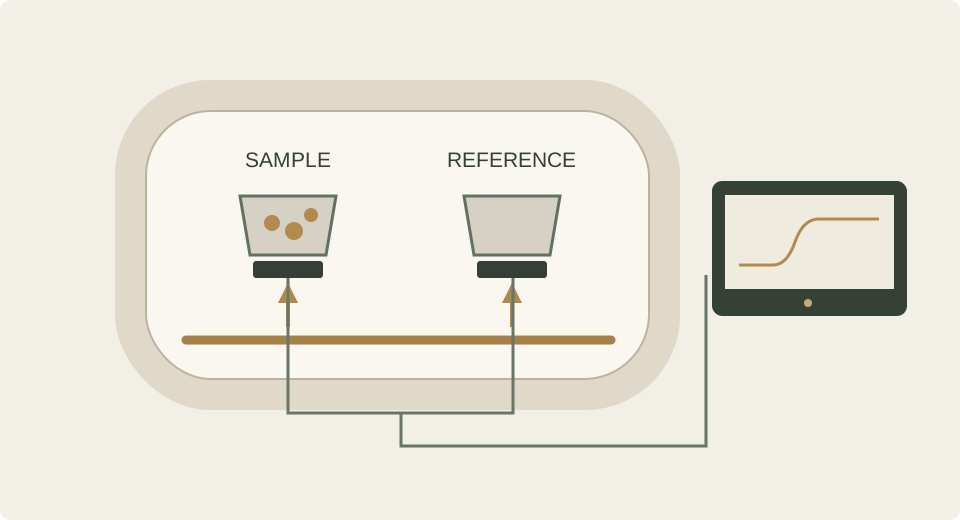
This is the basic composition of heat flux DSC that reads the thermal response difference between the sample and reference pans.
In practice, instead of simply writing "DSC measurement" on the analysis request, try to add a sentence summarizing the decisions based on the results received.
For example, a request like "Confirm if the differences shown in the first heating curves of the two lots are also observed in repeat measurements under the same conditions" clarifies the comparison targets.
It is also recommended to keep the numbers in the result table along with the original curves.
If only the transition temperature is communicated, it can be difficult for the analyst to recall which region was chosen and which baseline was used for reading.
Prepare the test condition table, original curves, and reading criteria as a bundle for review.
Step and melting peak are read differently
The glass transition (Tg) is observed as a step corresponding to changes in the heat capacity of the amorphous portion.
Around Tg, an overlap may occur due to enthalpy recovery.
The reported values may differ depending on the analysis method chosen for setting temperatures, such as the start point or midpoint.
Melting of the crystalline part is observed as an endothermic peak.
Integrating the area of the peak provides related enthalpy information.
Instead of only looking at whether it rises or falls on the screen, first check the direction of endothermic and the definition of the axes.
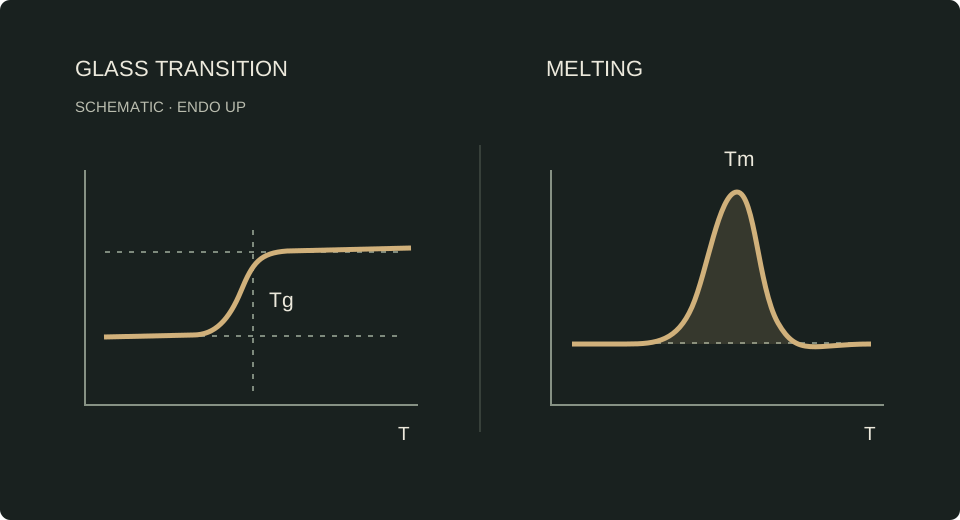
We begin by examining the differences in forms of step for glass transition and peak for melting.
| Items viewed in the report | Questions to confirm first | Notes to add in comparison log |
|---|---|---|
| Tg | Is it the start point or midpoint? | Whether the same reading criteria were applied to both results |
| Melting Temperature | Is it the peak temperature or start temperature? | Definitions and selected regions of the report items |
| Peak Area | Which baseline and integration area were used? | Units and mass normalisation status |
| Curve Shape | Are they reported over the same axis range? | Magnification ratio and endothermic direction |
This table serves as a self-examination framework for reviewing graphs.
The actual test report will confirm together the definitions used in the readings according to the analysis method and equipment.
The goal is to reduce errors associated with comparing temperature values with different meanings in a single column.
First heating and second heating address different questions
The first heating may contain thermal histories produced during the processing and storage of the sample.
The subsequent cooling and second heating will impact the results with the thermal history imposed during the test.
When interpreting the second curve, both previous heating and cooling conditions should be considered.
Example of Polymer Heating/Cooling in METTLER TOLEDO DSC Lecture
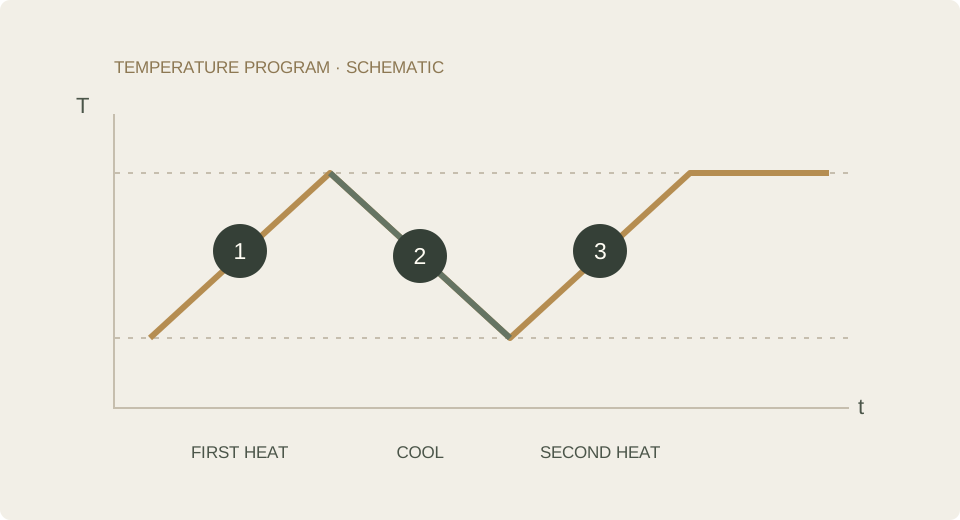
The cooling after the first heating also sets the conditions for the subsequent results.
You must read both preceding intervals together.
Be careful not to choose results as if "the second heating is always the answer."
If you leave only the second heating results for a question aimed at observing differences in the received conditions, it would make it difficult to review the differences initially observed.
Conversely, if you conclude material differences based solely on the first heating, it may not fully consider past histories.
In practical notes, conserve both curves and indicate which question each was used for.
Especially if there is a potential for the sample to deteriorate during the test, it’s necessary to review separately before interpreting under the assumption that "only the thermal histories are kept the same."
Repetitive heating itself should not be seen as the conclusion of verification.
Samples and conditions must match before comparisons begin
The contact status of the pan and sample, the material and sealing method of the pan, as well as the atmosphere, can influence measurements.
Therefore, it is crucial to ensure that the sample preparation and testing conditions match before overlapping the curves.
Description of Samples and Pans in METTLER TOLEDO DSC Lecture
| Category | Information to check side by side | MedQraft’s review suggestion |
|---|---|---|
| Samples | Lot, sampling location, pretreatment, mass | First, note what each sample represents |
| Test Configuration | Equipment, pans, lids, atmosphere | Don’t group as the same condition if there are differences |
| Temperature Program | Heating/cooling rates, ranges, holding periods | Preserve from the first heating to the last interval |
| Analysis | Baseline, reading method, units | Compare values read with the same definition |
For example, if samples taken from a thin surface layer and the interior of a finished product, stating they are “the same component” is insufficient.
You need to connect where the analysis requestor intended to examine and where the tester actually procured the samples.
At this point, methods such as marking the location on a diagram or including sampling photos in internal review materials can be employed.
The temperature range and the sealing status of the pan should be determined based on the characteristics of the samples and safety considerations of the equipment.
This article’s conceptual diagrams do not include actual operational temperatures and speeds.
Define the analysis purpose and choose applicable methods with the responsible tester.
Virtual case: The curves of two lots of polymer components differ
This is a hypothetical situation.
The first heating curves of the components taken from Lot A and Lot B are different.
The purchasing records list the same material name.
The development team wishes to know whether the change is due to raw material modification or processing conditions.
In the initial phase, instead of a conclusion, document the confirmed facts.
“Specific segment shapes of the first heating differ” and “the raw materials are different” are sentences at different levels of assertion.
First, secure the original curves and condition tables, and check if the sampling location, pretreatment, mass, and reading criteria match.
Next, confirm with the test supervisor the comparison plan that fits the questions.
Agree on the order in which to review the repeated results of samples prepared under the same conditions, processing histories, and curves after heating/cooling.
The number of repetitions or acceptable variations should be determined based on objectives and methods rather than arbitrarily based on observed results.
Even if we assume that the differences decrease in the second heating, do not end the investigation here.
Leave observations stating that “the curve differences decreased under these test conditions” and check if the historical data of the lots explains that observation.
If differences continue, review whether further material confirmation or evaluation of other properties is necessary based on the analysis purpose.
In any case, do not expand a single DSC result into a judgment of equivalency for the entire product.
It is advisable to organize the review results in the order of observation → comparative conditions → possible explanations → further confirming evidence.
Avoid mixing hypotheses with confirmed facts so that the next responsible person can understand the starting point of the judgment.
Five questions to leave when results are received
- What decision was intended to be made with this analysis, and does the current result answer that question?
- Is the sample’s source, sampling location, pretreatment, and entire temperature program recorded?
- Have the endothermic direction, units, baseline, and reading definitions of transition temperatures been confirmed?
- Have you distinguished the first heating from the second heating and documented the reasoning for interpretations?
- Have you separated parts that cannot be determined by observation from additional confirming evidence?
These questions are a suggested review method by MedQraft.
This is not a checklist of mandatory standard clauses.
The structure aims to aid in explaining how the results were used for decision-making processes when attaching analysis results to documents.
Related Article: Calibration Certificates and Measurement Purpose Fit.
When reading the analysis conditions, also examine whether the measurement basis used is appropriate for the purpose.
References and scope
- TA Instruments, Overview of Glass Transition Analysis by Differential Scanning Calorimetry, TA443.
The official technical note was consulted for the glass-transition step, enthalpy recovery, and temperature-reading methods.
Original - METTLER TOLEDO, Differential Scanning Calorimetry (DSC): Basics and Applications.
The English description of the official webinar was consulted for the principles, polymer thermal history, pans, and sample preparation.
This is introductory educational material, not a new product announcement.
Original
Checked on September 26, 2026.
MedQraft prepared the text and illustrations and did not reproduce the sources’ figures or tables.
The hypothetical case, comparison tables, and review questions are our own practical suggestions.
Applicable test methods and product-specific acceptance criteria require separate review based on the material, intended use, and applicable requirements.
Let's talk
Apply what you have read
to your product.
Tell us your product's current stage and the questions you need to review.
Discuss your questions ↗