
Sweat Sensor Flow Paths: Moving Old Samples Out and New Samples In
This article organizes development questions explaining the differences between continuous flow and sequential sampling based on the 2019 sweat analysis patch research, and examines sample residuals and response delays.
Sample Pathways Vary According to Sensor Response Mechanism
When designing a sweat analysis device, it is essential to determine the flow of the sample along with the detection elements.
If the same reaction unit can respond again to concentration changes, a configuration can be set up for fresh samples to pass through.
If the reagent does not return to its initial state after a reaction, a different reaction unit may be needed to handle the next sample.
This is why it is crucial to review the characteristics of the measurement device along with the sample processing structure.
The original research published by Bandodkar, Gutruf, and Choi in Science Advances in 2019 integrated these two approaches into a single skin-attached patch.
Lactate and glucose were read as electrochemical signals, while chloride and pH were monitored through color changes, also assessing the amount of sweat based on how filled the flow paths were.
This article explains the flow path design of the prototype developed for this research.
It is not an introduction to the specifications of currently commercialized products or their clinical performance.
A Sensor That Reactivates Must Have an Exit for Samples
The lactate and glucose sensors described in the paper utilize electrical signals generated from the target analytes’ reactions.
The researchers evaluated the properties of the signal changing again during experiments where concentrations were raised then lowered.
They employed a structure where sweat enters the sensor, passes through the reaction unit, and flows out the exit.
The electronic components that read and transmit the electrical signals apply power supply and data transfer through NFC, which is a type of near-field communication.
It is crucial to distinguish that the fact the sensor reaction generates electrical signals and the source of power for the electronic components are separate explanations.
Here, 'reactivating' means that the output does not instantly become the new concentration at the moment the sample changes.
The liquid left in the flow path and the sensor response time can both concurrently affect the results.
Moreover, even if the detection element can perform repeated measurements, it should not be assumed that the effects of usage duration or contamination can be disregarded.
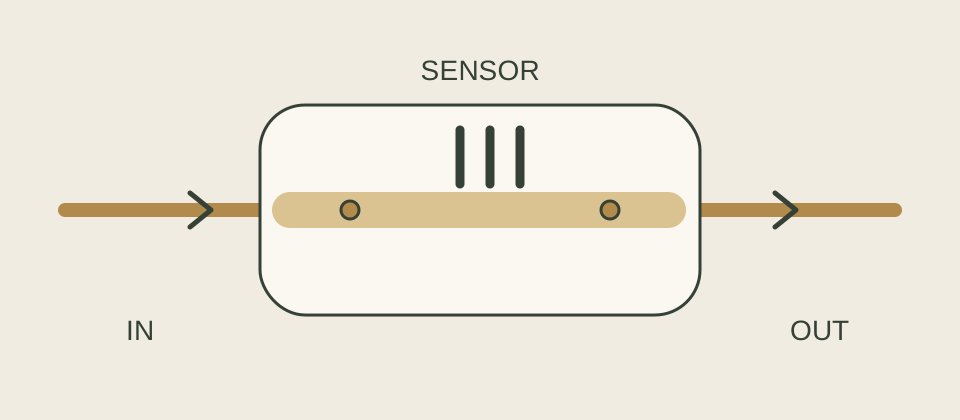
The structure where new samples flow through the reaction unit towards the exit considers both sample replacement and sensor response together.
Reagents That Have Reacted Are Separated into New Reaction Units
The chloride and pH colorimetric analysis section of this research does not involve recovering reacted reagents to return them to their original state.
The researchers configured microfluidics and manual valves to sequentially fill multiple storage compartments.
By storing samples separately in each compartment, changes based on the sampling order can be read.
This description pertains to a specific analysis section in the paper and does not imply that all color change sensors exhibit the same properties.
The valves are not devices that open according to a predetermined timetable like electronic switches.
In the paper, the pressure differences for opening capillary valves due to variations in the width and opening angles of the flow paths were utilized.
When sweat enters, the path that passes through first fills at a relatively lower pressure, followed by the flow to the next path.
Thus, simply numbering the compartments does not establish precise times or consistent sampling intervals.
It is essential to understand the actual flow rate and filling process.
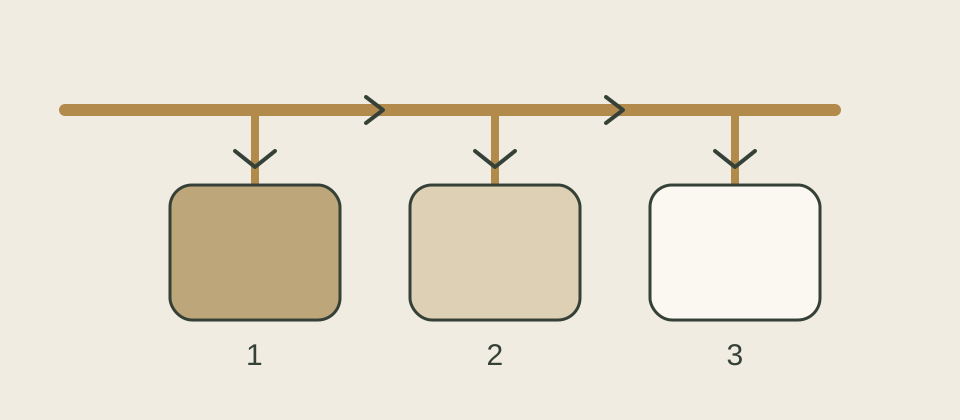
The separated chambers preserve the order of sampling.
The time intervals represented by each chamber must be linked to the actual filling process.
The two figures are concept diagrams and do not depict the actual shapes, dimensions, or manufacturing guidelines of the valves.
Comparison Targets and Confirmed Scope from the Paper
The research team investigated the concentration response of the sensor in laboratory settings, and examined the impacts of pH, temperature, repeated reactions, and mechanical deformation.
Human evaluations included measurements during exercise involving three healthy non-diabetic male volunteers.
For separate chloride comparisons, eight participants (6 males and 2 females) aged 18 to 45 participated, comparing sweat sample results with HPLC analyses.
It is appropriate not to read different test groups as a single integrated sample size.
Original Results: Human trials
| Evaluation | Comparison Conditions and Key Observations | Interpretation Scope |
|---|---|---|
| Laboratory Sensor Evaluation | Evaluated signals with varying concentrations and pH from standard solutions and artificial sweat | Responses depend on each sensor's conditions and are not a common pass criteria for products |
| Wear Evaluation During Exercise | Comparisons of sweat analysis of three healthy non-diabetic males against separate analysis methods | Feasibility of operation in limited populations and activities |
| Chloride Comparison | Comparison of sweat samples from a separate group of eight with HPLC results | Comparisons for specific analysis items and not a basis for blood test alternatives |
| Exploring Blood and Sweat Changes | Time comparisons under exercise and consumption conditions | Individual differences and time differences may require further study for broad clinical applications |
The researchers suggested that residue components from previous sweating could explain some outliers and discussed improvements to the flow and sample discharge in the reaction units.
This does not conclude that all outliers were proven to originate from residual samples.
The electronic component also had the limitation that the reader needed to be nearby to obtain data.
The authors suggested evaluating larger groups and improving sensor stability as future tasks.
MedQraft emphasizes the connection between measurement principles and sample handling.
It is not enough simply to specify what substance is being detected; the design of the flow path must also explain where the previous sample remains and how the new sample arrives at which reaction unit.
Virtual Design Consideration: If Two Types of Reaction Units Were to be Incorporated into One Patch
The following is not a test replicating the results of the paper but rather a virtual development case by MedQraft.
One team is reviewing a sensor A that reactivates to concentration changes and reagent B that must be replaced after a single use.
No actual samples or measurements exist yet.
For A, draw a flow path connecting the inlet, reaction unit, and exit; for B, outline several chambers for receiving samples.
At this stage, record the assumption that the sensor characteristic of A is suitable for repeated measurements, while that of B is disposable.
The next review will frame questions regarding whether the previous sample in A quickly exits to the outlet and if the sampling chambers for B fill in the intended order.
Simply appending 'capable of continuous measurement' to both structures will obscure the differences that need verifying.
| Self-Review Items | Continuous Flow Structure A | Sequential Sampling Structure B |
|---|---|---|
| Location of Previous Sample | Does it exit quickly or are there sections causing a backlog? | Does it affect already filled chambers moving to other chambers? |
| Meaning of New Result | Is the sensor response stable after switching samples? | Is it clear which sampling chamber and filling period the result originates from? |
| Observational Record | Timing of inflow changes, sample exchanges, and signal changes | Starting and ending times of filling per chamber, points confirming reactions |
| Exceptions | Flow decrease, residuals, response delays | Unfilled, different-than-expected sequence, intermixing between chambers |
Aligning Sample Replacement and Signal Changes on the Same Timeline
The following is not a legal test method but a proposal for self-developed checks.
First, narrow down the questions that the test will address.
By defining the observational target as 'how do the reaction unit and output change after the input sample changes?' instead of 'does a signal appear?', it becomes easier to examine the impacts of the flow path and sensor separately.
When reviewing sample switching, distinguish the time when the input conditions were altered, the basis for determining that new samples arrived in the reaction unit, and when the output changed.
If changes in the flow path and sensor signals are recorded simultaneously, it will be possible to interpret where delays occur.
It is advisable not to assume that the sample is completely replaced based solely on electrical signals.
Conversely, it is also unwise to conclude that the sensor response stabilized just because one observes the liquid moving visibly.
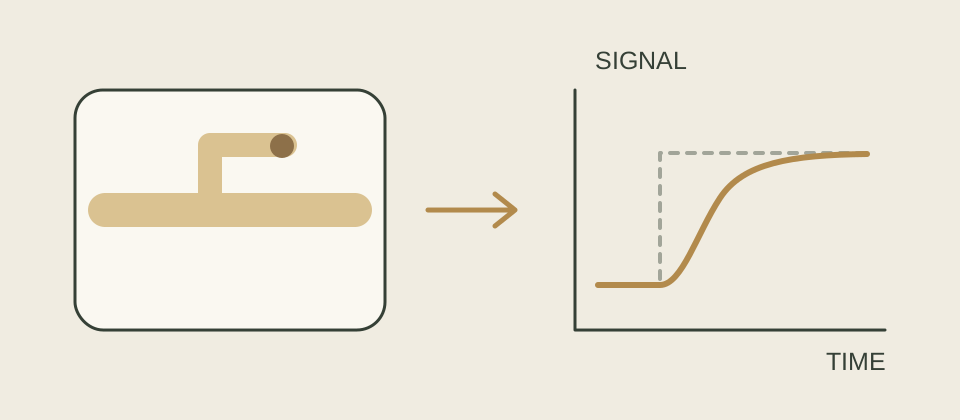
Sample residues and sensor responses are elements to differentiate when interpreting delays.
The right curve is a hypothetical concept diagram without numerical values.
Review records should include sample compositions, temperature, flow conditions, sensor usage history, identification information for the reaction unit, and analysis methods.
Acceptable levels of delay or residue should be defined separately according to intended use and required measurement performance.
This article does not present numerical criteria.
Upon completing the design review, questions may be asked about whether it is feasible to track the paths of both the previous and next samples on the diagram, whether results can be linked to specific sampling chambers or time intervals, and if the stopped intervals in measurement can actually be distinguished from periods that were consistently valued.
If the answers to these three questions differ, that leads to a re-examination of the sample processing structure or the method of result display as well.
Paper Information and Usage Scope
- Title: Battery-free, skin-interfaced microfluidic/electronic systems for simultaneous electrochemical, colorimetric, and volumetric analysis of sweat
- Authors: Amay J.
Bandodkar, Philipp Gutruf, Jungil Choi, et al., John A.
Rogers. - Full author list available in the original text.
- Journal/Publication Date: Science Advances 5(1), eaav3294, January 18, 2019.
- Type: Original research in a peer-reviewed journal, including laboratory evaluations and small human subject assessments.
- DOI: 10.1126/sciadv.aav3294.
- Journal Page, Europe PMC Full Text, PubMed Citation.
- License: CC BY-NC 4.0. Not interpreted as permission for commercial reuse.
This article does not include paper figures, tables, photographs, or translations but instead consists of fact explanations, original cases, and diagrams.
- Confirmation Date: October 9, 2026.
The introduction, results, discussion, methods, and rights statements of the Europe PMC public XML full text were reviewed.
No separate analyses were performed on supplementary files or raw data.
There was no indication of retraction in the public XML, and related notices were not found in DOI searches or retraction lookups.
Access to the full text on the journal and PubMed webpages is not seamless, thus it cannot be directly stated that the latest status of those pages was checked.
Related Articles
Signal Principles in Photoacoustic Patch Research discusses conversion between light and sound.
Performance Test Comparison Conditions explains conditions to leave when comparing different measurement outcomes.
Let's talk
Apply what you have read
to your product.
Tell us your product's current stage and the questions you need to review.
Discuss your questions ↗